Chartjs is a very popular pure javascript library for making graphs and charts in our application. Angular chartjs or using chartjs in our Angular we can create different types of charts with animate charts from our data. Chart js is written in pure javaScript and html5 using canvas.
Angular Charts and Angular graphs are popular visual ways of showing relationships between data. We can easily understand and remember data in chart form. We often use charts and graphs to demonstrate trends, patterns, and relationships between sets of data.
In this tutorial, we’ll learn and have following objective to achieves.
- How to used chartjs library to make different charts. ?
- Demonstrate an Angular chart example on pie, line, doughnut, and double line.
- Customize height and width value of the chart in Angular.
Other popular Angular chart libraries.
Like angular chartjs we can have HighCharts and D3js are the JavaScript library for data visualization. HighCharts Angular library is the official minimal Highcharts wrapper for Angular. We have a lot of other libraries’ options to add a chart in Angular, here I had listed some popular chart library.
| Name | Description |
| Chart.js | Most popular, simple yet flexible JavaScript charting for designers & developers. It has weekly downloaded of around 2,017,855 and 21.1MB. |
| ngx-charts | It use Angular to render and animate the SVG elements with all of its binding and speed goodness, and uses d3 for the excellent math functions, scales, axis and shape generators. It has weekly downloaded of around 125,317 and 6.03 MB. |
| ngx-echarts | This library is an open-sourced, web-based, cross-platform framework that supports the rapid construction of interactive visualization. Weekly download of around 44,422 and size 152KB. |
| ng2-charts | Beautiful charts for Angular based on Chart.js provide eight different chart. Weekly download of around 174,600 and 208KB. |
| highcharts | Highcharts is a JavaScript charting library based on SVG rendering. This project includes Stock, the financial charting package, the Maps package for geo maps and the Gantt package. It has weekly download of around 912,075 and 50.5MB. |
| D3 | D3 (or D3.js) is a JavaScript library for visualizing data using web standards. D3 helps you bring data to life using SVG, Canvas and HTML. It has weekly download of around 1,791,758 and size of 868 kB. |
We already have articles on these angular charting libraries with an example.
What is chartjs library?
The chart.js is a pure Javascript library that uses the HTML5 < canvas> element to display graphs, which is perfect for an HTML5 mobile application. The charts are super simple to set up, they look beautiful, and they are responsive by default. We can easily scale with your application as you change between devices or screen orientation.
Adding Angular chartjs to our application ?
Let create first create an angular project to demonstrate an example of how to add a chart library in our angular projects.
ng new chartApps
npm install chart.js --save
The above command will install chartjs library in our angular application. We also created different components for each Angular chartjs example. Let’s add the following components to our application.
ng generate component pie-chart
ng generate component doughnut-chart
ng generate component line-chart
ng generate component bar-chart
ng generate component doubleLine-chart
Angular chart js example
We have created five components, each component has a different chart. In each component template, we have a canvas element. We had added a local variable like so #canvasname to each component canvas so that we can easily grab a reference to it from our TypeScript file via viewChild() decorator.
Edit app.component.html to add all our five charts component tag names.
<app-bar-chart></app-bar-chart>
<app-pie-chart></app-pie-chart>
<app-doughnut-chart></app-doughnut-chart>
<app-line-chart></app-line-chart>
<app-double-line-chart></app-double-line-chart>

<router-outlet></router-outlet>
Angular pie chart example using angualr Chartjs
We’ll first demonstrate the Angular pie charts example, we have already created a pie chart component. Here is a screenshot of our pie chart example.
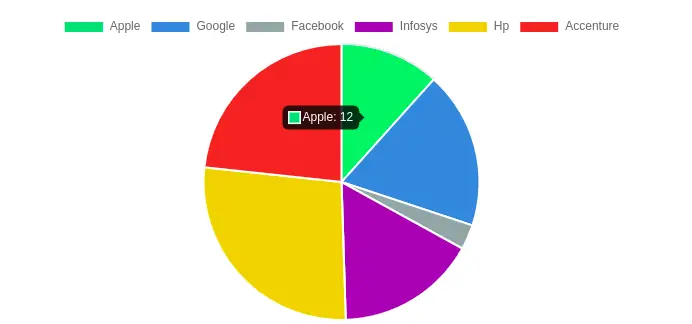
Let’s edit the pie-chart.component.html template to add a canvas called #pieCanvas, which we render our pie chart. We can get a reference to the pie chart canvas using angular ViewChild.
<div>
    <h1>1. Pie chart</h1>
    <canvas #pieCanvas style="height:20vh; width:40vw"></canvas>
    <hr color="red">
</div>
Edit pie-chart.component.ts, we need to import ViewChild, ElementRef from the angular core package, and chart from chartjs library.
import { AfterViewInit, Component, ViewChild } from '@angular/core';
import Chart from 'chart.js/auto'

@Component({
  selector: 'app-pie-chart',
  templateUrl: './pie-chart.component.html',
  styleUrls: ['./pie-chart.component.scss'],
})
export class PieChartComponent implements AfterViewInit {
  canvas: any;
  ctx: any;
  @ViewChild('pieCanvas') pieCanvas!: { nativeElement: any };

  pieChart: any;

  constructor() {}

  ngAfterViewInit(): void {
    this.pieChartBrowser();
  }

  pieChartBrowser(): void {
    this.canvas = this.pieCanvas.nativeElement;
    this.ctx = this.canvas.getContext('2d');

    this.pieChart = new Chart(this.ctx, {
      type: 'pie',
      data: {
        labels: ['Apple', 'Google', 'Facebook', 'Infosys', 'Hp', 'Accenture'],
        datasets: [
          {
            backgroundColor: [
              '#2ecc71',
              '#3498db',
              '#95a5a6',
              '#9b59b6',
              '#f1c40f',
              '#e74c3c',
            ],
            data: [12, 19, 3, 17, 28, 24],
          },
        ],
      },
    });
  }
}
We have imported the @ViewChild decorator, to grab a reference to the local variable that we have attached to the canvas in the template, and then we supply that element to the new Chart when we are creating a chart. All we have to do is supply a Chart with an object that defines the type of chart we want, and the type of data we want to display.
When we try to call our chart method in ngOnInit it shows an error nativeElement of undefined and we need to call all chart methods in ngAfterViewInit() where @ViewChild and @ViewChildren will be resolved.
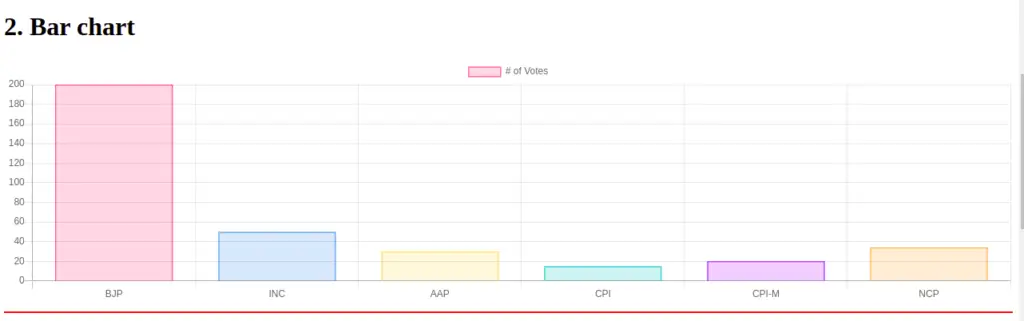
Angular bar chart example using Angular Chart js
In our bar-chart component, we’re demonstrating an angular bar chart example. Here is the screenshot of what we are achieving. We have displayed a demo example of voting results on an angular bar chart.
In our bar-chart.component.html template, we need to add canvas to render our bar chart. We have add local reference called #barCanvas canvas element.
<div>
    <h1>2. Bar chart</h1>
    <canvas #barCanvas style="height:10vh; width:20vw"></canvas>
    <hr color="red">
</div>
We need to edit the bar-chart.component.ts file to add chartjs object and data for our bar chart. In Chartjs Chart object we need to specify chart type. Chart type can determine the type of chart we want to build. Chart type can be line, bar, pie, doughnut, and more.
import { AfterViewInit, Component, ElementRef, ViewChild } from '@angular/core';
import Chart from 'chart.js/auto';

@Component({
  selector: 'app-bar-chart',
  templateUrl: './bar-chart.component.html',
  styleUrls: ['./bar-chart.component.scss'],
})
export class BarChartComponent implements AfterViewInit {
  @ViewChild('barCanvas') barCanvas: ElementRef | undefined;
  barChart: any;

  constructor() {}

  ngAfterViewInit(): void {
    this.barChartMethod();
  }

  barChartMethod() {
    this.barChart = new Chart(this.barCanvas?.nativeElement, {
      type: 'bar',
      data: {
        labels: ['BJP', 'INC', 'AAP', 'CPI', 'CPI-M', 'NCP'],
        datasets: [
          {
            label: '# of Votes',
            data: [200, 50, 30, 15, 20, 34],
            backgroundColor: [
              'rgba(255, 99, 132, 0.2)',
              'rgba(54, 162, 235, 0.2)',
              'rgba(255, 206, 86, 0.2)',
              'rgba(75, 192, 192, 0.2)',
              'rgba(153, 102, 255, 0.2)',
              'rgba(255, 159, 64, 0.2)',
            ],
            borderColor: [
              'rgba(255,99,132,1)',
              'rgba(54, 162, 235, 1)',
              'rgba(255, 206, 86, 1)',
              'rgba(75, 192, 192, 1)',
              'rgba(153, 102, 255, 1)',
              'rgba(255, 159, 64, 1)',
            ],
            borderWidth: 1,
          },
        ],
      },
      options: {
        scales: {
          y: {
            beginAtZero: true,
          },
        },
      },
    });
  }
}
Example of Angular Doughnut chart
Doughnut charts are meant to express a “part-to-whole” relationship, where all pieces together represent 100%. Doughnut charts work best to display data with a small number of categories from 2 to 5. In our doughnut component, we are adding a doughnut chart. Let’s add canvas to render our doughnut chart. Edit doughnut-chart.component.html to add canvas element and we have our local reference on canvas element through ViewChild decorator.
<div>
    <h1>3. Doughnut chart</h1>
    <canvas #doughnutCanvas style="height:10vh; width:20vw"></canvas>
    <hr color="red">
</div>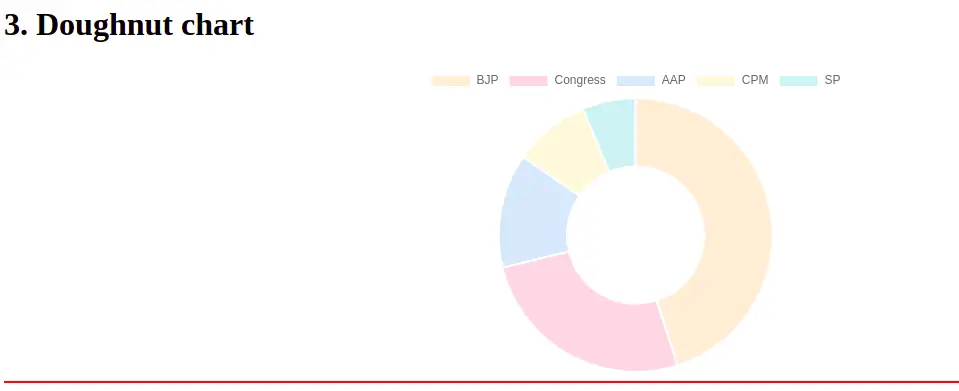
We have added the hr element to make a division between each angular chartjs component in our parent component app.component.htm template. Let edit the doughnut-chart.component.ts file to include chartjs object and data for the doughnut chart.
import { AfterViewInit, Component, ElementRef, OnInit, ViewChild } from '@angular/core';
import { Chart } from 'chart.js';
@Component({
selector: 'app-doughnut-chart',
templateUrl: './doughnut-chart.component.html',
styleUrls: ['./doughnut-chart.component.scss'],
})
export class DoughnutChartComponent implements AfterViewInit {
@ViewChild('doughnutCanvas') doughnutCanvas: ElementRef | undefined;
doughnutChart: any;
constructor() {}
ngAfterViewInit() {
this.doughnutChartMethod();
}
doughnutChartMethod() {
this.doughnutChart = new Chart(this.doughnutCanvas?.nativeElement, {
type: 'doughnut',
data: {
labels: ['BJP', 'Congress', 'AAP', 'CPM', 'SP'],
datasets: [
{
label: '# of Votes',
data: [50, 29, 15, 10, 7],
backgroundColor: [
'rgba(255, 159, 64, 0.2)',
'rgba(255, 99, 132, 0.2)',
'rgba(54, 162, 235, 0.2)',
'rgba(255, 206, 86, 0.2)',
'rgba(75, 192, 192, 0.2)',
],
hoverBackgroundColor: [
'#FFCE56',
'#FF6384',
'#36A2EB',
'#FFCE56',
'#FF6384',
],
},
],
},
});
}
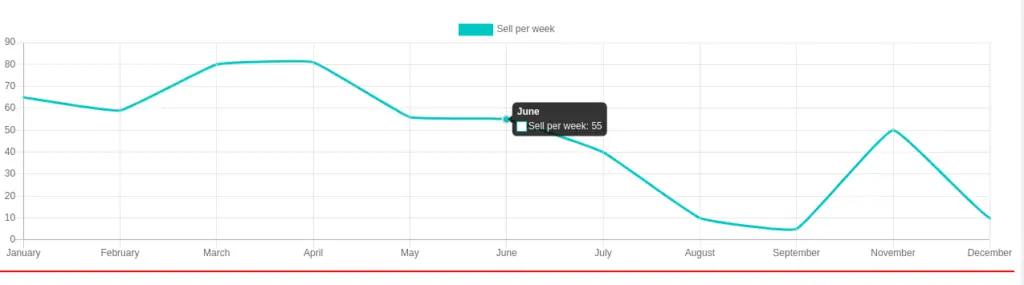
}Angular chartjs line chart example
Line charts are mostly used to represent data over a continuous time span. Generally used to show a trend of a measure (or a variable) over time, used in stocks. Here is a screenshot of our Angular line chart example.
Let’s edit the line-chart.component.html template to include our canvas for the line chart.
<div>
    <h1>4. Line chart</h1>
    <canvas #lineCanvas style="height:10vh; width:20vw"></canvas>
    <hr color="red">
</div>
In our line-chart.component.ts file, we need to import angular chartjs and data for the line chart.
import { AfterViewInit, Component, ElementRef, ViewChild } from '@angular/core';
import Chart from 'chart.js/auto';

@Component({
  selector: 'app-line-chart',
  templateUrl: './line-chart.component.html',
  styleUrls: ['./line-chart.component.scss'],
})
export class LineChartComponent implements AfterViewInit {
  @ViewChild('lineCanvas') lineCanvas: ElementRef | undefined;
  lineChart: any;

  constructor() {}

  ngAfterViewInit(): void {
    this.lineChartMethod();
  }

  lineChartMethod() {
    this.lineChart = new Chart(this.lineCanvas?.nativeElement, {
      type: 'line',
      data: {
        labels: [
          'January',
          'February',
          'March',
          'April',
          'May',
          'June',
          'July',
          'August',
          'September',
          'November',
          'December',
        ],
        datasets: [
          {
            label: 'Sell per week',
          //  lineTension: 0.2,
            fill: false,
            backgroundColor: 'rgba(75,192,192,0.4)',
            borderColor: 'rgba(75,192,192,1)',
            borderCapStyle: 'butt',
            borderDash: [],
            borderDashOffset: 0.0,
            borderJoinStyle: 'miter',
            pointBorderColor: 'rgba(75,192,192,1)',
            pointBackgroundColor: '#fff',
            pointBorderWidth: 1,
            pointHoverRadius: 5,
            pointHoverBackgroundColor: 'rgba(75,192,192,1)',
            pointHoverBorderColor: 'rgba(220,220,220,1)',
            pointHoverBorderWidth: 2,
            pointRadius: 1,
            pointHitRadius: 10,
            data: [65, 59, 80, 81, 56, 55, 40, 10, 5, 50, 10, 15],
            spanGaps: false,
          },
        ],
      },
    });
  }
}
Angular chartjs size customize : setting width and height
In all previous charts component, we have specified angular chartjs size directly on our canvas. Is best practice to remove the inline style and put style separate into our scss file. We can’t change chart size by adding id and class name directly on a canvas element.
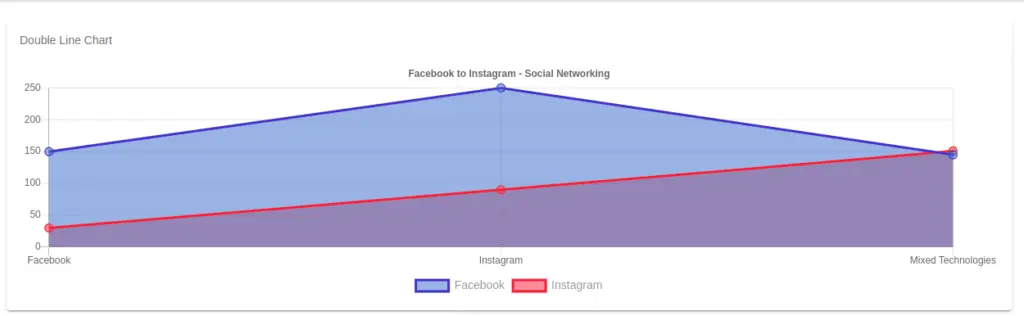
We can control angular chartjs size by controlling the width and height of the canvas container. Let’s add a container to our double line chart example and edit our template. Here is a screenshot of our double-line chart.
Edit double-line-chart.component.html to the canvas element and remove inline style on our canvas. We have added a container with id ‘double-line-chart-container’ on our canvas element.
<div>
    <h1>4. Line chart</h1>
    <canvas #doubleLineCanvas style="height:10vh; width:20vw"></canvas>
    <hr color="red">
</div>
To change the height and width of our chart canvas we can control through container style only. Let edit double-line.component.scss file.
#double-line-chart-container {
    height: 200px;
    width: 400px;
}
Edit the double-line.component.ts file to import chartjs and data for our double line chart.
import {
  AfterViewInit,
  Component,
  ElementRef,
  OnInit,
  ViewChild,
} from '@angular/core';
import Chart from 'chart.js/auto';
@Component({
  selector: 'app-double-line-chart',
  templateUrl: './double-line-chart.component.html',
  styleUrls: ['./double-line-chart.component.scss'],
})
export class DoubleLineChartComponent implements AfterViewInit {
  @ViewChild('doubleLineCanvas') doubleLineCanvas: ElementRef | undefined;
  doubleLineChart: any;

  constructor() {}

  ngAfterViewInit(): void {
    this.doubleLineChartMethod();
  }

  doubleLineChartMethod(): void {
    this.doubleLineChart = new Chart(this.doubleLineCanvas?.nativeElement, {
      type: 'line',
      data: {
        labels: ['Facebook', 'Instagram', 'Mixed Technologies'],
        datasets: [
          {
            label: 'Facebook',
            data: [150, 250, 145, 100],
            backgroundColor: 'rgba(40,125,200,.5)',
            borderColor: 'rgb(40,100,200)',
            fill: true
          },
          {
            label: 'Instagram',
            data: [30, 90, 151, 220],
            backgroundColor: 'rgba(240,78,71,.5)',
            borderColor: 'rgb(240,78,71)',
            fill: true
          },
        ],
      },

      options: {
        responsive: true,
        plugins: {
          title: {
            display: true,
            position: 'top',
            text: 'Facebook to Instagram - Social Networking',
            color: '#666',
            font: {
              size: 12,
            },
          },

          legend: {
            display: true,
            position: 'bottom',
            labels: {
              color: '#999',
              font: {
                size: 14
              }
            },
          },
        },
      },
    });
  }
}
I had upload Pie, Bar and Doughnut chart example in stackblitz.com, if you want to refere you can check the code in stackblitz.com
Conclusion
We have explored how we can include charts and graphs in our angular project. You can modify this code according to your choice and we have added this code to the GitHub repository. This was a small introduction to how we can use angular chartjs in our angular ionic project. Chartjs and D3js are amazing chart libraries and you can explore more depth in the official documentation.
Related Post