D3js is a powerful and popular open-source data visualization library and helps to visualize or represent data in a chart inside a web application. We’ll demonstrate two examples of the Angular d3js chart.
The D3js is standard for data visualization that allows us to create more complex and provide more flexibility in creating data visualization on the web. We have a lot of libraries for adding charts in an Agular like chartjs and angular2-highcharts.
The Angular D3js has a more learning curve as compared to other chart libraries. In this article, we’ll demonstrate how to implement the Angular D3js chart.
Setup and integrate Angular D3js project.
With D3 version 4 is a collection of the modules and we can use each module independently, with minimum dependency. Let first create an Angular project and integrate d3js into our project. We’ll add two-component for each bar and a pie chart of d3js in Angular 10.
ng new d3js
npm install d3 --save
ng generate component bar-chart
ng generate component pie-chart
Add data for Angular D3js charts example
Once we have created our project and install all required components and the D3js library. We need data for both charts, let’s first set up the data on which D3 is generating the chart. Create a new folder called data and add data.ts a file in the data folder. Add the following data in the src/data/data.ts file
export const StatsPieChart: any[] = [
    {party: 'BJP', electionP: 56},
    {party: 'INC', electionP: 18},
    {party: 'AA', electionP: 10},
    {party: 'CPI', electionP: 5},
    {party: 'CPI-M', electionP: 5},
    {party: 'BSP', electionP: 7},
    {party: 'AITS',  electionP: 10}
];

export interface Employee {
    company: string;
    frequency: number;
}

export const StatsBarChart: Employee[] = [
    {company: 'Apple', frequency: 100000},
    {company: 'IBM', frequency: 80000},
    {company: 'HP', frequency: 20000},
    {company: 'Facebook', frequency: 70000},
    {company: 'TCS', frequency: 12000},
    {company: 'Google', frequency: 110000},
    {company: 'Wipro', frequency: 5000},
    {company: 'EMC', frequency: 4000}
];
We need to edit|add an Angular routing for both pie and bar chart components.
import { NgModule } from '@angular/core';
import { CommonModule } from '@angular/common';
import { RouterModule, Routes } from '@angular/router';
import { BarChartComponent } from './bar-chart/bar-chart.component';
import { PieChartComponent } from './pie-chart/pie-chart.component';

const routes: Routes = [
  { path: '', component: BarChartComponent },
  { path: 'barChart', component: BarChartComponent },
  {  path: 'pieChart', component: PieChartComponent }
];

@NgModule({
  declarations: [],
  imports: [ CommonModule, RouterModule.forRoot(routes) ],
  exports: [RouterModule]
})
export class AppRoutingModule { }
Edit app.module.ts to add an Agular routing module.
import { BrowserModule } from '@angular/platform-browser';
import { NgModule } from '@angular/core';
import { AppComponent } from './app.component';
import { BarChartComponent } from './bar-chart/bar-chart.component';
import { PieChartComponent } from './pie-chart/pie-chart.component';
import { AppRoutingModule } from './app-routing.module';
import { NgbModule } from '@ng-bootstrap/ng-bootstrap';


@NgModule({
  declarations: [
    AppComponent,
    BarChartComponent,
    PieChartComponent,
  ],
  imports: [
    BrowserModule,
    AppRoutingModule,
    NgbModule
  ],
  providers: [],
  bootstrap: [AppComponent]
})
export class AppModule { }
We have used ng-bootstrap to display the button in the grid and is optional. If you want to install ng-bootstrap in angular check our previous articles. Edit app.component.html template to add navigation for both charts.
<div class="container m-t-6">
    <button type="button" class="btn btn-success m-3" routerLink="/barChart">Bar Chart</button>
    <button type="button" class="btn btn-success" routerLink="/pieChart">Pie Chart</button>
</div>
<router-outlet></router-outlet>
Example of a Angular D3js bar chart
Let first create a bar chart for Angular D3js example, we generate a bar chart on the number of employees in a popular IT company. This is just fake data, for example, we are using it.
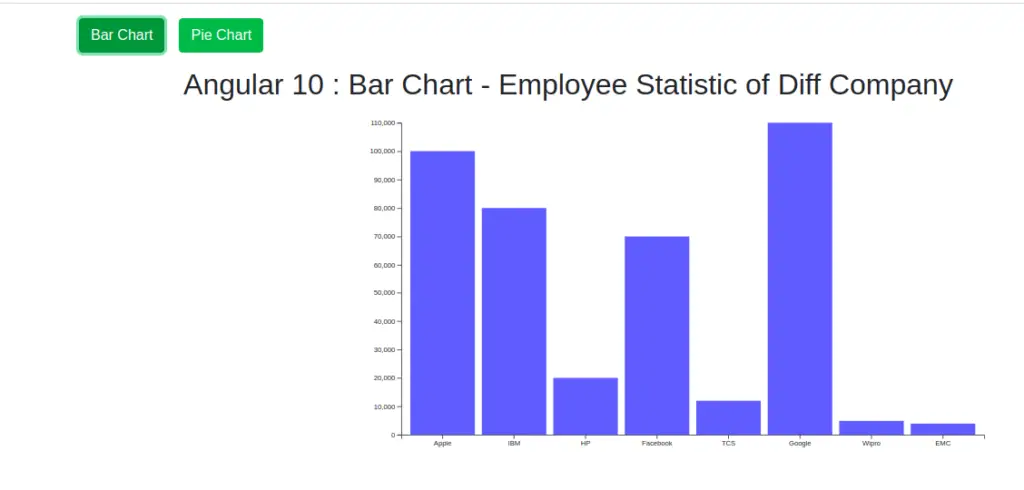
Modify the bar.chart.component.html, we have added id=”barChart” on a div to add a reference in our typescript where we attach our bar chart.
<h2 >Angular 10 : Bar Chart - Employee Statistic of Diff Company</h2>
<div id="barChart" style="position: relative; height:60vh; width:120vw"></div>
Now let’s import our bar chart data and requires the d3js module in our bar chart component typescript and add code for our chart in the bar-chart.component.ts file.
import { Component, OnInit } from '@angular/core';
import { StatsBarChart } from '../../assets/data/data';

import * as d3 from 'd3-selection';
import * as d3Scale from 'd3-scale';
import * as d3Array from 'd3-array';
import * as d3Axis from 'd3-axis';

@Component({
  selector: 'app-bar-chart',
  templateUrl: './bar-chart.component.html',
  styleUrls: ['./bar-chart.component.scss']
})
export class BarChartComponent implements OnInit {
  currentRate = 8;
  title = 'D3 Barchart with Angular 10';
  width: number;
  height: number;
  margin = { top: 20, right: 20, bottom: 30, left: 40 };
  x: any;
  y: any;
  svg: any;
  g: any;

  constructor() {
    this.width = 900 - this.margin.left - this.margin.right;
    this.height = 500 - this.margin.top - this.margin.bottom;
  }

  ngOnInit() {
    this.initSvg();
    this.initAxis();
    this.drawAxis();
    this.drawBars();
  }

  initSvg() {
    this.svg = d3.select('#barChart')
      .append('svg')
      .attr('width', '100%')
      .attr('height', '100%')
      .attr('viewBox', '0 0 900 500');
    this.g = this.svg.append('g')
      .attr('transform', 'translate(' + this.margin.left + ',' + this.margin.top + ')');
  }

  initAxis() {
    this.x = d3Scale.scaleBand().rangeRound([0, this.width]).padding(0.1);
    this.y = d3Scale.scaleLinear().rangeRound([this.height, 0]);
    this.x.domain(StatsBarChart.map((d) => d.company));
    this.y.domain([0, d3Array.max(StatsBarChart, (d) => d.frequency)]);
  }

  drawAxis() {
    this.g.append('g')
      .attr('class', 'axis axis--x')
      .attr('transform', 'translate(0,' + this.height + ')')
      .call(d3Axis.axisBottom(this.x));
    this.g.append('g')
      .attr('class', 'axis axis--y')
      .call(d3Axis.axisLeft(this.y))
      .append('text')
      .attr('class', 'axis-title')
      .attr('transform', 'rotate(-90)')
      .attr('y', 6)
      .attr('dy', '0.71em')
      .attr('text-anchor', 'end')
      .text('Frequency');
  }

  drawBars() {
    this.g.selectAll('.bar')
      .data(StatsBarChart)
      .enter().append('rect')
      .attr('class', 'bar')
      .attr('x', (d) => this.x(d.company))
      .attr('y', (d) => this.y(d.frequency))
      .attr('width', this.x.bandwidth())
      .attr('fill', '#498bfc')
      .attr('height', (d) => this.height - this.y(d.frequency));
  }

}
Example of Angular D3js pie chart of D3js
Let’s demonstrate the pie chart for the Angular D3js example, we generate a bar chart on the number of display election results. This is just fake data, for example, we are using it.
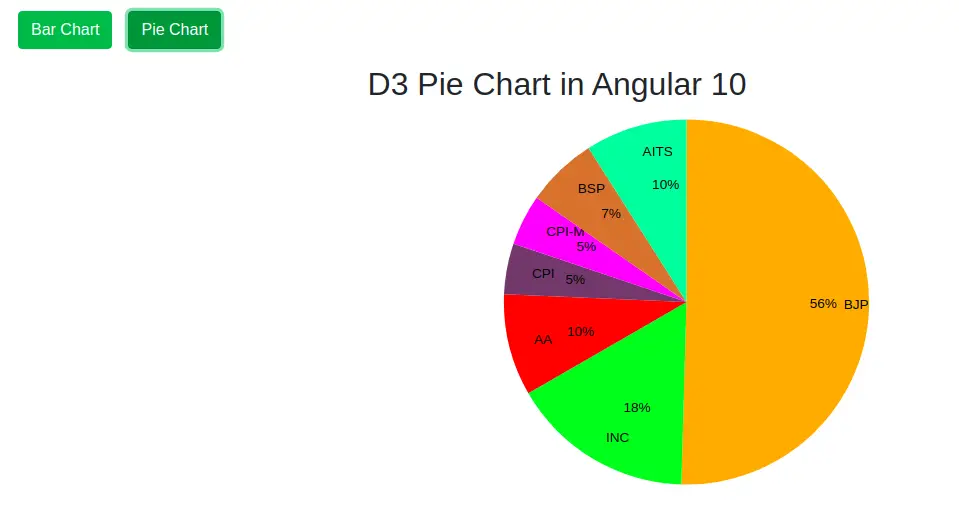
Modify the pie.chart.component.html, we have added id=”pieChart” on a div to add a reference in our typescript where we attach our pie chart.
<h2 >{{ title }}</h2>
<div id="pieChart" style="position: relative; height:60vh; width:120vw"></div>
Now let’s import our pie chart data and requires d3js module in our bar chart component typescript and add code for our chart in the pie-chart.component.ts file.
import { Component, OnInit } from '@angular/core';
import { StatsPieChart } from '../../assets/data/data';

import * as d3 from 'd3-selection';
import * as d3Scale from 'd3-scale';
import * as d3Shape from 'd3-shape';

@Component({
  selector: 'app-pie-chart',
  templateUrl: './pie-chart.component.html',
  styleUrls: ['./pie-chart.component.scss']
})
export class PieChartComponent implements OnInit {

  title = 'D3 Pie Chart in Angular 10';

  margin = {top: 20, right: 20, bottom: 30, left: 50};
  width: number;
  height: number;
  radius: number;

  arc: any;
  labelArc: any;
  labelPer: any;
  pie: any;
  color: any;
  svg: any;

  constructor() {
    this.width = 900 - this.margin.left - this.margin.right ;
    this.height = 500 - this.margin.top - this.margin.bottom;
    this.radius = Math.min(this.width, this.height) / 2;
  }

  ngOnInit() {
    this.initSvg();
    this.drawPie();
  }

  initSvg() {
    this.color = d3Scale.scaleOrdinal()
        .range(['#FFA500', '#00FF00', '#FF0000', '#6b486b', '#FF00FF', '#d0743c', '#00FA9A']);
    this.arc = d3Shape.arc()
        .outerRadius(this.radius - 10)
        .innerRadius(0);
    this.labelArc = d3Shape.arc()
        .outerRadius(this.radius - 40)
        .innerRadius(this.radius - 40);

    this.labelPer = d3Shape.arc()
        .outerRadius(this.radius - 80)
        .innerRadius(this.radius - 80);

    this.pie = d3Shape.pie()
        .sort(null)
        .value((d: any) => d.electionP);

    this.svg = d3.select('#pieChart')
        .append('svg')
        .attr('width', '100%')
        .attr('height', '100%')
        .attr('viewBox', '0 0 ' + Math.min(this.width, this.height) + ' ' + Math.min(this.width, this.height))
        .append('g')
        .attr('transform', 'translate(' + Math.min(this.width, this.height) / 2 + ',' + Math.min(this.width, this.height) / 2 + ')');
  }

  drawPie() {
    const g = this.svg.selectAll('.arc')
        .data(this.pie(StatsPieChart))
        .enter().append('g')
        .attr('class', 'arc');
    g.append('path').attr('d', this.arc)
        .style('fill', (d: any) => this.color(d.data.party) );
    g.append('text').attr('transform', (d: any) => 'translate(' + this.labelArc.centroid(d) + ')')
        .attr('dy', '.35em')
        .text((d: any) => d.data.party);

    g.append('text').attr('transform', (d: any) => 'translate(' + this.labelPer.centroid(d) + ')')
        .attr('dy', '.35em')
        .text((d: any) => d.data.electionP + '%');
  }
}
Conclusion
We have completed our Angular D3js charts project. We have demonstrated two examples of D3js in Angular 10. There is plenty of libraries to add charts to our Angular project. But D3js is one of the most used and popular libraries to display real-life charts data.
Related posts