Charts are an important visual representation of data and ionic allows us to add a chart from a different library. In this example, we will learn how to add HighCharts in ionic with an example. In ionic, we can easily implement data visualization through charts and graphs. Ionic allows us to choose numbers of the option to use charts in the Ionic apps.
The HighChart, Chartjs, and D3js are most popular the JavaScript library for data visualization. We have a lot of other libraries’ options to add a chart in Angular. Where D3js is the most popular open-source and Highcharts is a product that was created by the Norway-based company, Highsoft.
In this tutorial, we will explore and learn how to used highcharts library in Ionic angular.
Prerequisites:
To create and run an Ionic project, We need nodejs and Ionic CLI already install in our system, if not then check how to install nodejs and Ionic in Ubuntu. Ionic CLI allows us to create an Ionic project, generate application and library code, and perform a variety of ongoing development tasks such as testing, bundling, and deployment. To install the Ionic CLI, open a terminal, and run the following command:
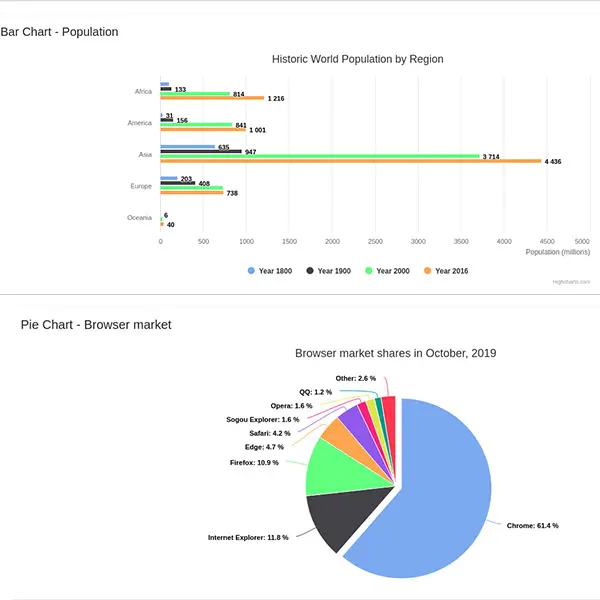
npm install -g @ionic/cliHere’s a quick screenshot of what we’ll be building.
Setting up and configure project for HighCharts in Ionic
In our project, we are demonstrating two charts of an example of highcharts.I have taken both chart information from highcharts official demo page.
- The bar charts contain information about the world population.
- The pie a chart containing information on the browser market
ionic start highChartEx blank --type=angular
npm install highcharts --save
Example of Highcharts in Ionic
In our home page template, we will display two examples of highchairs in an Ionic project. Edit home.page.html file as.
Step 3: Add the following code in the home.page.ts file
import { Component } from '@angular/core';
import * as HighCharts from 'highcharts';
@Component({
  selector: 'app-home',
  templateUrl: 'home.page.html',
  styleUrls: ['home.page.scss'],
})
export class HomePage {

  constructor() { }

  ionViewDidEnter() {
    this.barChartPopulation();
    this.pieChartBrowser();
  }


  barChartPopulation() {
    HighCharts.chart('barChart', {
      chart: {
        type: 'bar'
      },
      title: {
        text: 'Historic World Population by Region'
      },
      xAxis: {
        categories: ['Africa', 'America', 'Asia', 'Europe', 'Oceania'],
      },
      yAxis: {
        min: 0,
        title: {
          text: 'Population (millions)',
          align: 'high'
        },
      },
      tooltip: {
        valueSuffix: ' millions'
      },
      plotOptions: {
        bar: {
          dataLabels: {
            enabled: true
          }
        }
      },
      series: [{
        type: undefined,
        name: 'Year 1800',
        data: [107, 31, 635, 203, 2]
      }, {
        type: undefined,
        name: 'Year 1900',
        data: [133, 156, 947, 408, 6]
      }, {
        type: undefined,
        name: 'Year 2000',
        data: [814, 841, 3714, 727, 31]
      }, {
        type: undefined,
        name: 'Year 2016',
        data: [1216, 1001, 4436, 738, 40]
      }]
    });
  }

  pieChartBrowser() {
    HighCharts.chart('pieChart', {
      chart: {
        plotBackgroundColor: null,
        plotBorderWidth: null,
        plotShadow: false,
        type: 'pie'
      },
      title: {
        text: 'Browser market shares in October, 2019'
      },
      tooltip: {
        pointFormat: '{series.name}: <b>{point.percentage:.1f}%</b>'
      },
      plotOptions: {
        pie: {
          allowPointSelect: true,
          cursor: 'pointer',
          dataLabels: {
            enabled: true,
            format: '<b>{point.name}</b>: {point.percentage:.1f} %'
          }
        }
      },
      series: [{
        name: 'Brands',
        colorByPoint: true,
        type: undefined,
        data: [{
          name: 'Chrome',
          y: 61.41,
          sliced: true,
          selected: true
        }, {
          name: 'Internet Explorer',
          y: 11.84
        }, {
          name: 'Firefox',
          y: 10.85
        }, {
          name: 'Edge',
          y: 4.67
        }, {
          name: 'Safari',
          y: 4.18
        }, {
          name: 'Sogou Explorer',
          y: 1.64
        }, {
          name: 'Opera',
          y: 1.6
        }, {
          name: 'QQ',
          y: 1.2
        }, {
          name: 'Other',
          y: 2.61
        }]
      }]
    });
  }

}
Step 4: Add the following code to the home.page.html template
<ion-header>
  <ion-toolbar>
    <ion-title>
      Bar Charts / HighCharts
    </ion-title>
  </ion-toolbar>
</ion-header>

<ion-content>
  <div class="ion-padding">
    <ion-card>
      <ion-card-header>
        <ion-card-title>Bar Chart - Population </ion-card-title>
      </ion-card-header>
      <ion-card-content>
        <div id="barChart" style="min-width: 310px; max-width: 800px; height: 400px; margin: 0 auto"></div>
      </ion-card-content>
    </ion-card>

    <ion-card>
      <ion-card-header>
        <ion-card-title>Pie Chart - Browser market</ion-card-title>
      </ion-card-header>
      <ion-card-content>
        <div id="pieChart" style="width:100%; height:400px;"></div>
      </ion-card-content>
    </ion-card>
  </div>
</ion-content>
In highcharts, we have a series object is a set of data. For example, a line graph or one set of columns. All data plotted on a chart comes from the series object.
The type of series, for example, line or column. By default, the series type is inherited from chart.type, so unless the chart is a combination of series types, there is no need to set it on the series level.
HighCharts are used by tens of thousands of developers and many big companies in the world including Facebook, Yahoo, Visa, and More. Highcharts is the simplest yet most flexible charting API on the market. Create stock or general timeline charts for your web and mobile apps.
Conclusion
In this tutorial, we have demonstrated two examples highcharts in Ionic in the project.
Related posts