The D3 path has lots of generators, the arc generator is most common generator beside the line. The D3 arc generator is a lot more versatile than the simple SVG circle element. The arc generator can create circle or pie, annulus or donut, circle sector and annulus sector.
The D3.arc can draw Circular or annular sectors, as in a pie or donut chart.
Syntax var arc2 = d3.arc()
The D3 arc has two optional fields: startingAngle and endAngle. When we have zero value for
var arc = d3.arc()
    .innerRadius(0)
    .outerRadius(100)
    .startAngle(0)
    .endAngle(Math.PI / 2);
If the arc generator has a context, then the arc is rendered to this context as a sequence of path method calls and this function returns void. Otherwise, a path data string is returned.
Here we will create pie and donut chart on Election result of BJP seat win.
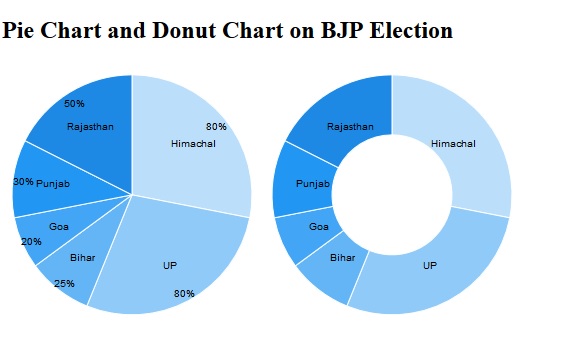
In this example, we need our data in excel format. The data.csv contain the state and seat information as
state,count
Himachal,80
UP,80
Bihar,25
Goa,20
Punjab,30
Rajasthan,50
Step 1: Add the following code in index.html
<!DOCTYPE html>
<html>
    <head>
        <meta charset="utf-8">
        <title>Pie Charts</title>
<link rel="stylesheet" type="text/css" href="css/style.css">

 <script src="//d3js.org/d3.v4.min.js" charset="utf-8"></script>

    </head>
    <body>
        <h2>Pie Chart and Donut Chart on BJP Election</h2>

        <script type="text/javascript" src="js/pie.js"></script>

    </body>

</html
Step 2: Add the following code in style.css
.arc text {
  font: 10px sans-serif;
  text-anchor: middle;
}

.arc path {
  stroke: #fff;
}

.arc2 text {
  font: 10px sans-serif;
  text-anchor: middle;
}

.arc2 path {
  stroke: #fff;
}
Step 3: Add the following code in pie.js file
Abstract for what we are doing.
- First set the width and height for our SVG element.
- Create two arcs, one for pie and one for a donut. The arc of innerRadius zero for pie chart.
- Generate pie chart and donut chart // generate pie chart and donut chart var pie = d3.pie() .sort(null) .value(function(d) { return d.count; });
- Define two SVG elements to the body element.
- Import the data and
d3.csv("data.csv", function(error, data) {parse each element using data.forEach
// margin
var margin = {top: 20, right: 20, bottom: 20, left: 20},
    width = 300 - margin.right - margin.left,
    height = 300 - margin.top - margin.bottom,
    radius = width/2;

// color range
var color = d3.scaleOrdinal()
    .range(["#BBDEFB", "#90CAF9", "#64B5F6", "#42A5F5", "#2196F3", "#1E88E5", "#1976D2"]);

// pie chart arc. Need to create arcs before generating pie
var arc = d3.arc()
    .outerRadius(radius - 10)
    .innerRadius(0);

// donut chart arc
var arc2 = d3.arc()
    .outerRadius(radius - 10)
    .innerRadius(radius - 70);


// arc for the labels position
var labelArc = d3.arc()
    .outerRadius(radius - 50)
    .innerRadius(radius - 50);

// arc for the labels position for %
var labelPer = d3.arc()
    .outerRadius(radius - 20)
    .innerRadius(radius - 20);


// generate pie chart and donut chart
var pie = d3.pie()
    .sort(null)
    .value(function(d) { return d.count; });

// define the svg for pie chart
var svg = d3.select("body").append("svg")
    .attr("width", width)
    .attr("height", height)
  .append("g")
    .attr("transform", "translate(" + width / 2 + "," + height / 2 + ")");

// define the svg donut chart
var svg2 = d3.select("body").append("svg")
    .attr("width", width)
    .attr("height", height)
  .append("g")
    .attr("transform", "translate(" + width / 2 + "," + height / 2 + ")");

// import data
d3.csv("data.csv", function(error, data) {
  if (error) throw error;

    // parse data
    data.forEach(function(d) {
        d.count = +d.count;
        d.state = d.state;
    })

  // "g element is a container used to group other SVG elements"
  var g = svg.selectAll(".arc")
      .data(pie(data))
    .enter().append("g")
      .attr("class", "arc");

  // append path
  g.append("path")
      .attr("d", arc)
      .style("fill", function(d) { return color(d.data.state); })
    // transition
    .transition()
      .ease(d3.easeLinear)
      .duration(2000)
      .attrTween("d", tweenPie);

  // append text
  g.append("text")
    .transition()
      .ease(d3.easeLinear)
      .duration(2000)
    .attr("transform", function(d) { return "translate(" + labelArc.centroid(d) + ")"; })
      .attr("dy", ".35em")
      .text(function(d) { return d.data.state; });

      // append text
  g.append("text")
    .transition()
      .ease(d3.easeLinear)
      .duration(2000)
    .attr("transform", function(d) { return "translate(" + labelPer.centroid(d) + ")"; })
      .attr("dy", ".55em")
      .text(function(d) { return d.data.count + "%"; });


    // "g element is a container used to group other SVG elements"
  var g2 = svg2.selectAll(".arc2")
      .data(pie(data))
    .enter().append("g")
      .attr("class", "arc2");

   // append path
  g2.append("path")
      .attr("d", arc2)
      .style("fill", function(d) { return color(d.data.state); })
    .transition()
      .ease(d3.easeLinear)
      .duration(2000)
      .attrTween("d", tweenDonut);

   // append text
  g2.append("text")
    .transition()
      .ease(d3.easeLinear)
      .duration(2000)
    .attr("transform", function(d) { return "translate(" + labelArc.centroid(d) + ")"; })
      .attr("dy", ".35em")
      .text(function(d) { return d.data.state; });

});

// Helper function for animation of pie chart and donut chart
function tweenPie(b) {
  b.innerRadius = 0;
  var i = d3.interpolate({startAngle: 0, endAngle: 0}, b);
  return function(t) { return arc(i(t)); };
}

function tweenDonut(b) {
  b.innerRadius = 0;
  var i = d3.interpolate({startAngle: 0, endAngle: 0}, b);
  return function(t) { return arc2(i(t)); };
}